
The Vulnerability Curve Bent With the AI Curve
By Prince Chaddha
11 min read
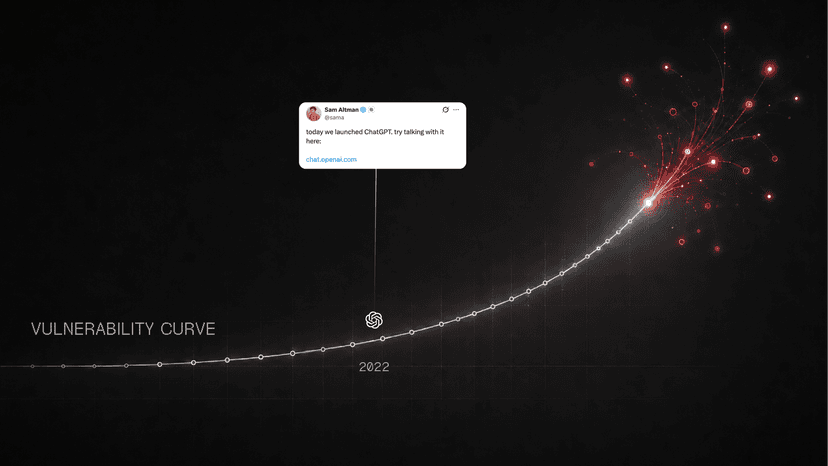
Table of Contents
Authors
How CVE volume, known-exploited counts and time-to-exploit all changed shape across the LLM build-out and why defenders are now on the wrong side of the clock.
In 2018 the world published about 18,000 CVEs and the average vulnerability took roughly two months to get exploited after it went public. By 2025 the world was publishing nearly 50,000 CVEs a year and the average vulnerability was being exploited before it was disclosed.
Those two facts are the whole story. The number of vulnerabilities went vertical and the time you have to react went negative. Both inflections line up with the same three years that gave us ChatGPT, GPT-4, reasoning models and agentic coding.
We pulled the vulnerability numbers directly from ProjectDiscovery's vulnx, bucketed every CVE by its publication year and overlaid the AI timeline on top. This post walks the data chart by chart. Every source is listed at the end.
A note on the data: the CVE, severity and known-exploited counts are live from vulnx, but the supporting figures (time-to-exploit, remediation time, zero-day counts, supply-chain volume and cost) come from other named third-party sources, with a few 2026 values projected rather than measured. Anything projected is labeled as such on the chart and in the text.
1. The volume went vertical
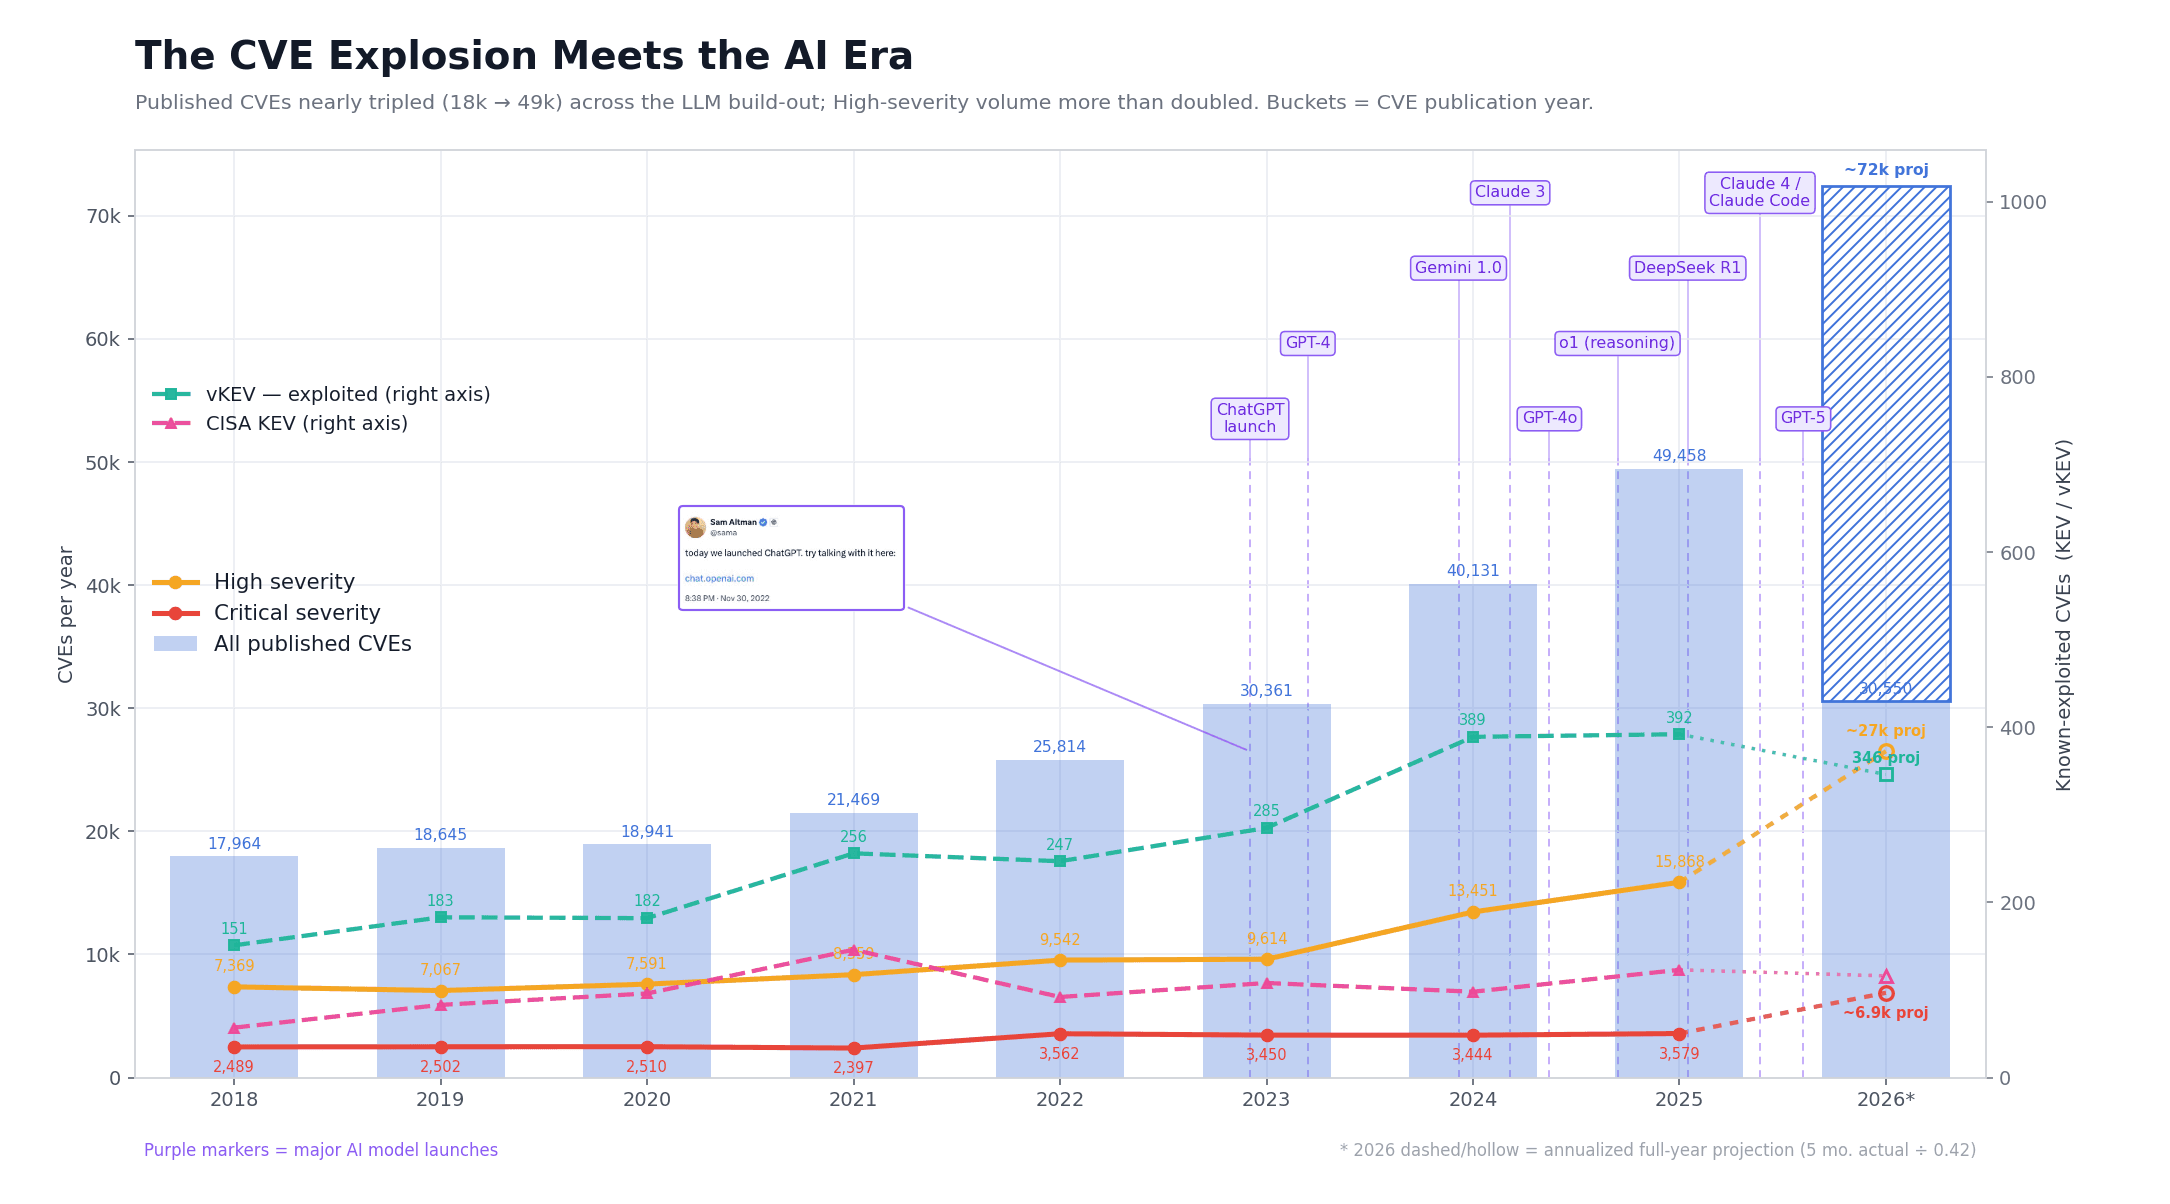
From 2018 to 2021, CVE output was flat, roughly 18k to 21k per year. Then it bent:
| Year | Published CVEs | CISA KEV | vKEV | Critical | High |
|---|---|---|---|---|---|
| 2018 | 17,964 | 57 | 151 | 2,489 | 7,369 |
| 2019 | 18,645 | 83 | 183 | 2,502 | 7,067 |
| 2020 | 18,941 | 96 | 182 | 2,510 | 7,591 |
| 2021 | 21,469 | 146 | 256 | 2,397 | 8,359 |
| 2022 | 25,814 | 92 | 247 | 3,562 | 9,542 |
| 2023 | 30,361 | 108 | 285 | 3,450 | 9,614 |
| 2024 | 40,131 | 98 | 389 | 3,444 | 13,451 |
| 2025 | 49,458 | 123 | 392 | 3,579 | 15,868 |
| 2026* | 30,550 | 49 | 146 | 2,906 | 11,187 |
- 2026 is partial (through Jun 3). At ~5 months it was already over 60% of all of 2025. Rows confirmed by vulnx data.
The steepest single jumps, 2023→2024 (+32%) and 2024→2025 (+23%), land exactly on the agentic-coding and reasoning-model wave. More code, written faster, by more people and more machines, means more vulnerabilities.
The exploitable surface is doubling faster than defenders can absorb
The severity split is where this lands on security teams. High-severity CVEs more than doubled across the window (7.4k → 15.9k), so the pile of genuinely exploitable bugs that someone has to find, judge and fix grew far faster than headcount or budget did. Strip out the bookkeeping noise (the CVE program expanded and the Linux kernel alone now issues thousands of low-severity CVEs a year) and the high-severity flood is still real, still roughly a doubling and still climbing through exactly the years AI-assisted coding and AI-assisted discovery took off.
The throughput on the defensive side did not move with it. The same teams, the same patch windows, far more landing in the queue each week than the team can clear. That mismatch is the story this whole post is about and it only gets sharper in the signals no assignment policy can pad: what actually gets exploited, how often and how fast.
2. The pile-up
Per-year bars undersell the problem, because vulnerabilities do not expire on December 31. A CVE published in 2021 is still a live entry point in 2026 if nobody patched it. Plenty never did. Roughly 13% of Log4j downloads in 2025 were still the version vulnerable to Log4Shell, about 40 million pulls, nearly four years after the fix shipped (Sonatype via Infosecurity Magazine). The number that describes a defender's actual job is not this year's flow of new bugs, it is the running stock of everything disclosed and not yet fixed.
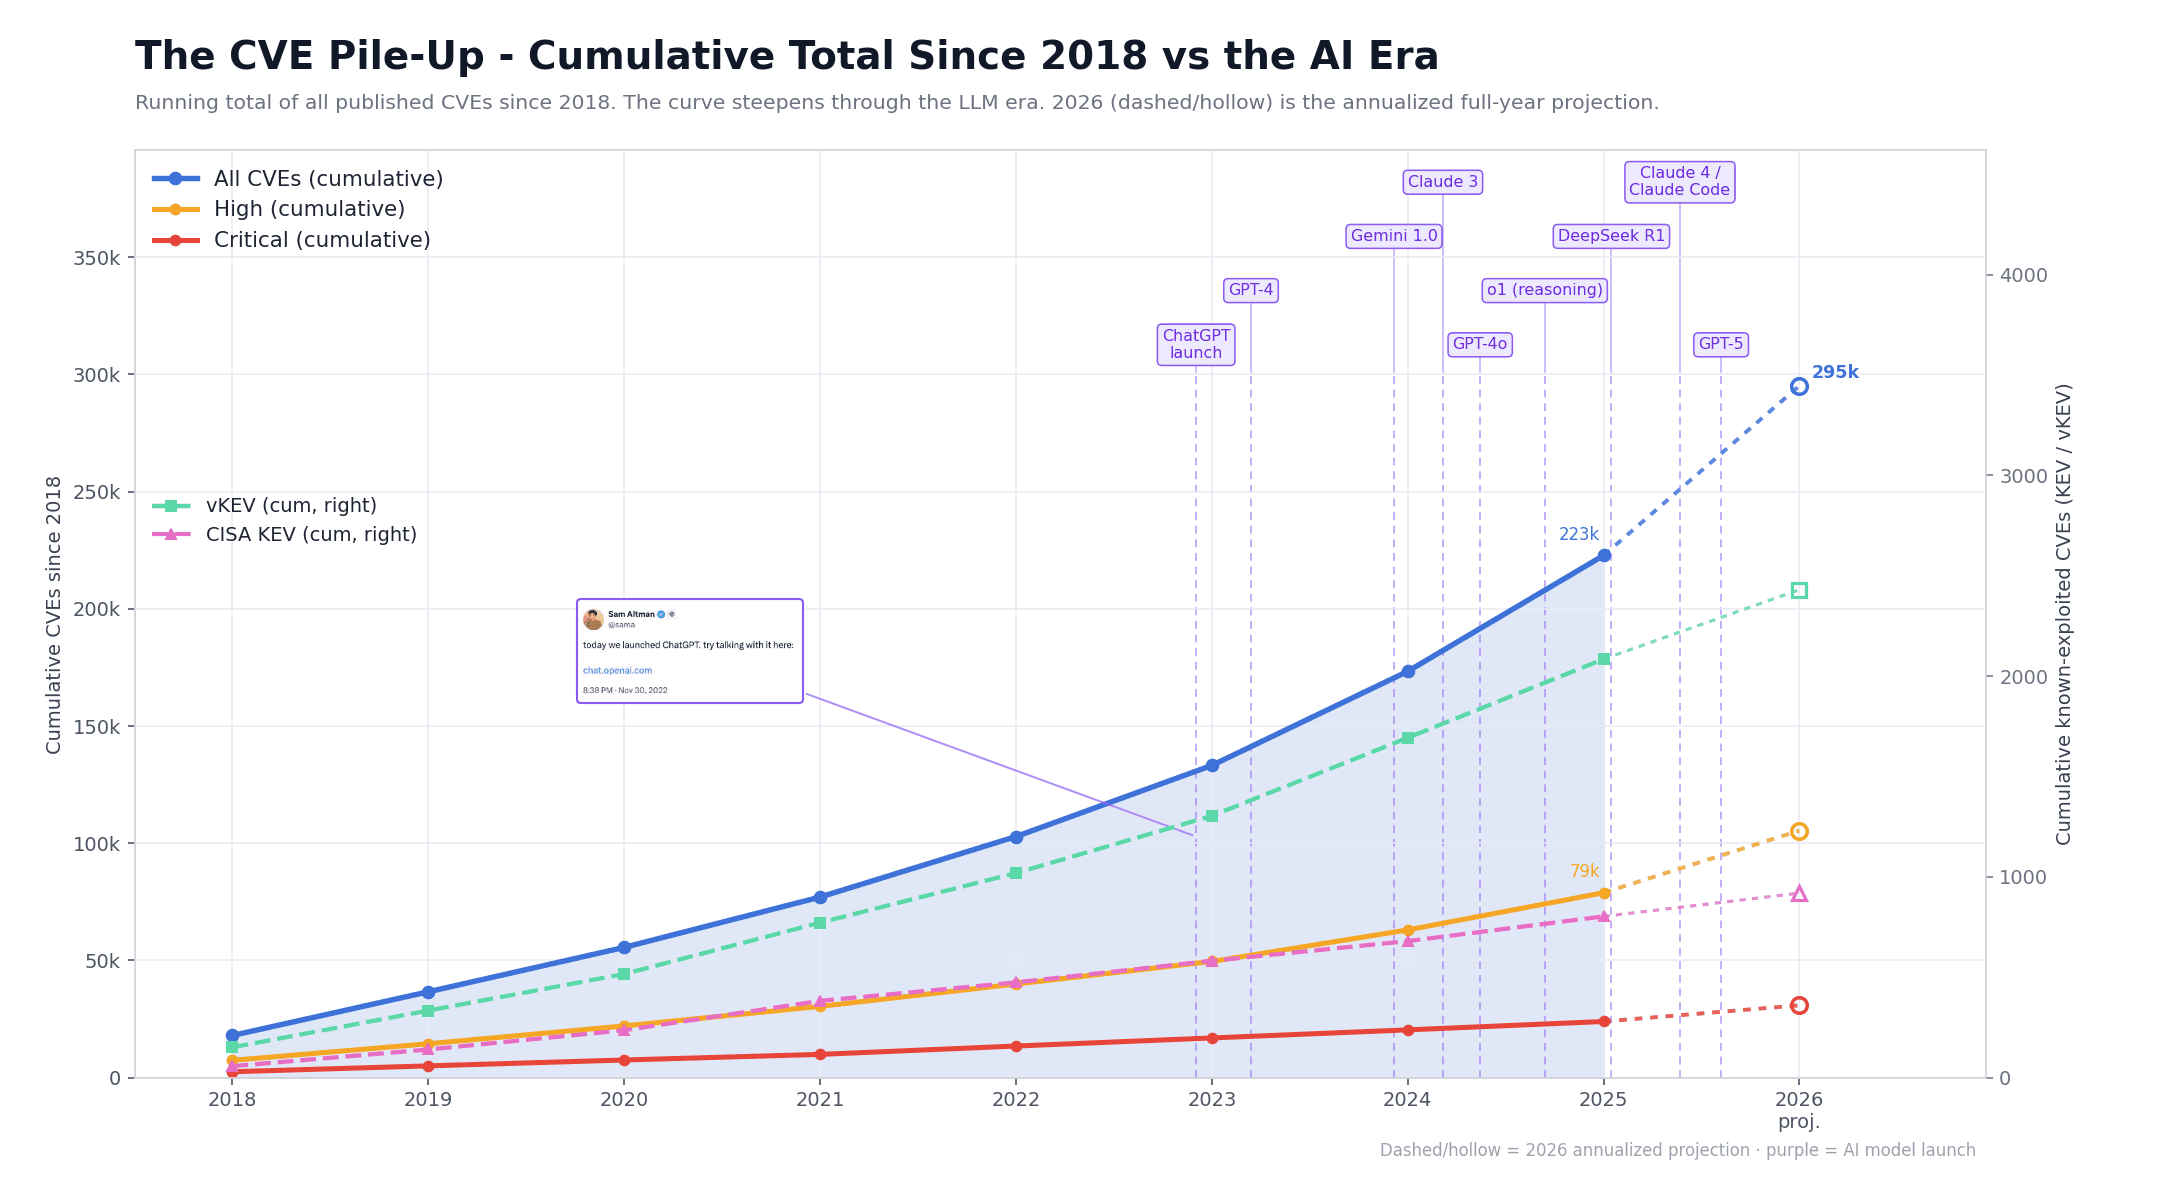
Stack the years and the shape is hard to argue with. The total passed a quarter-million published CVEs by the end of 2025, around 223,000, on track to cross 290,000 once 2026's projected pace is counted. The line is nearly flat through the pre-LLM years, then turns into a wall right as the models arrive.
The split underneath that curve is the convincing part. The four years before ChatGPT, 2018 through 2021, produced about 77,000 CVEs between them. The four years after, 2022 through 2025, produced roughly 146,000, nearly double the prior span in the same amount of time (both totals sum straight from the vulnx counts in the table above). Almost two-thirds of every CVE in that eight-year window landed in the last four years. A team that already felt underwater in 2021 is now carrying close to twice the historical backlog. That backlog compounds every quarter instead of resetting in January. None of it goes away until someone patches it.
3. Zero-days are now the engine
A zero-day is a vulnerability that gets exploited before any patch exists, so a defender has zero days of warning and nothing to install. An n-day is the opposite. The fix is already out and attackers just hit the organizations that have not applied it yet. Zero-days are the more dangerous kind, because being diligent does not help when there is no patch to be diligent about.
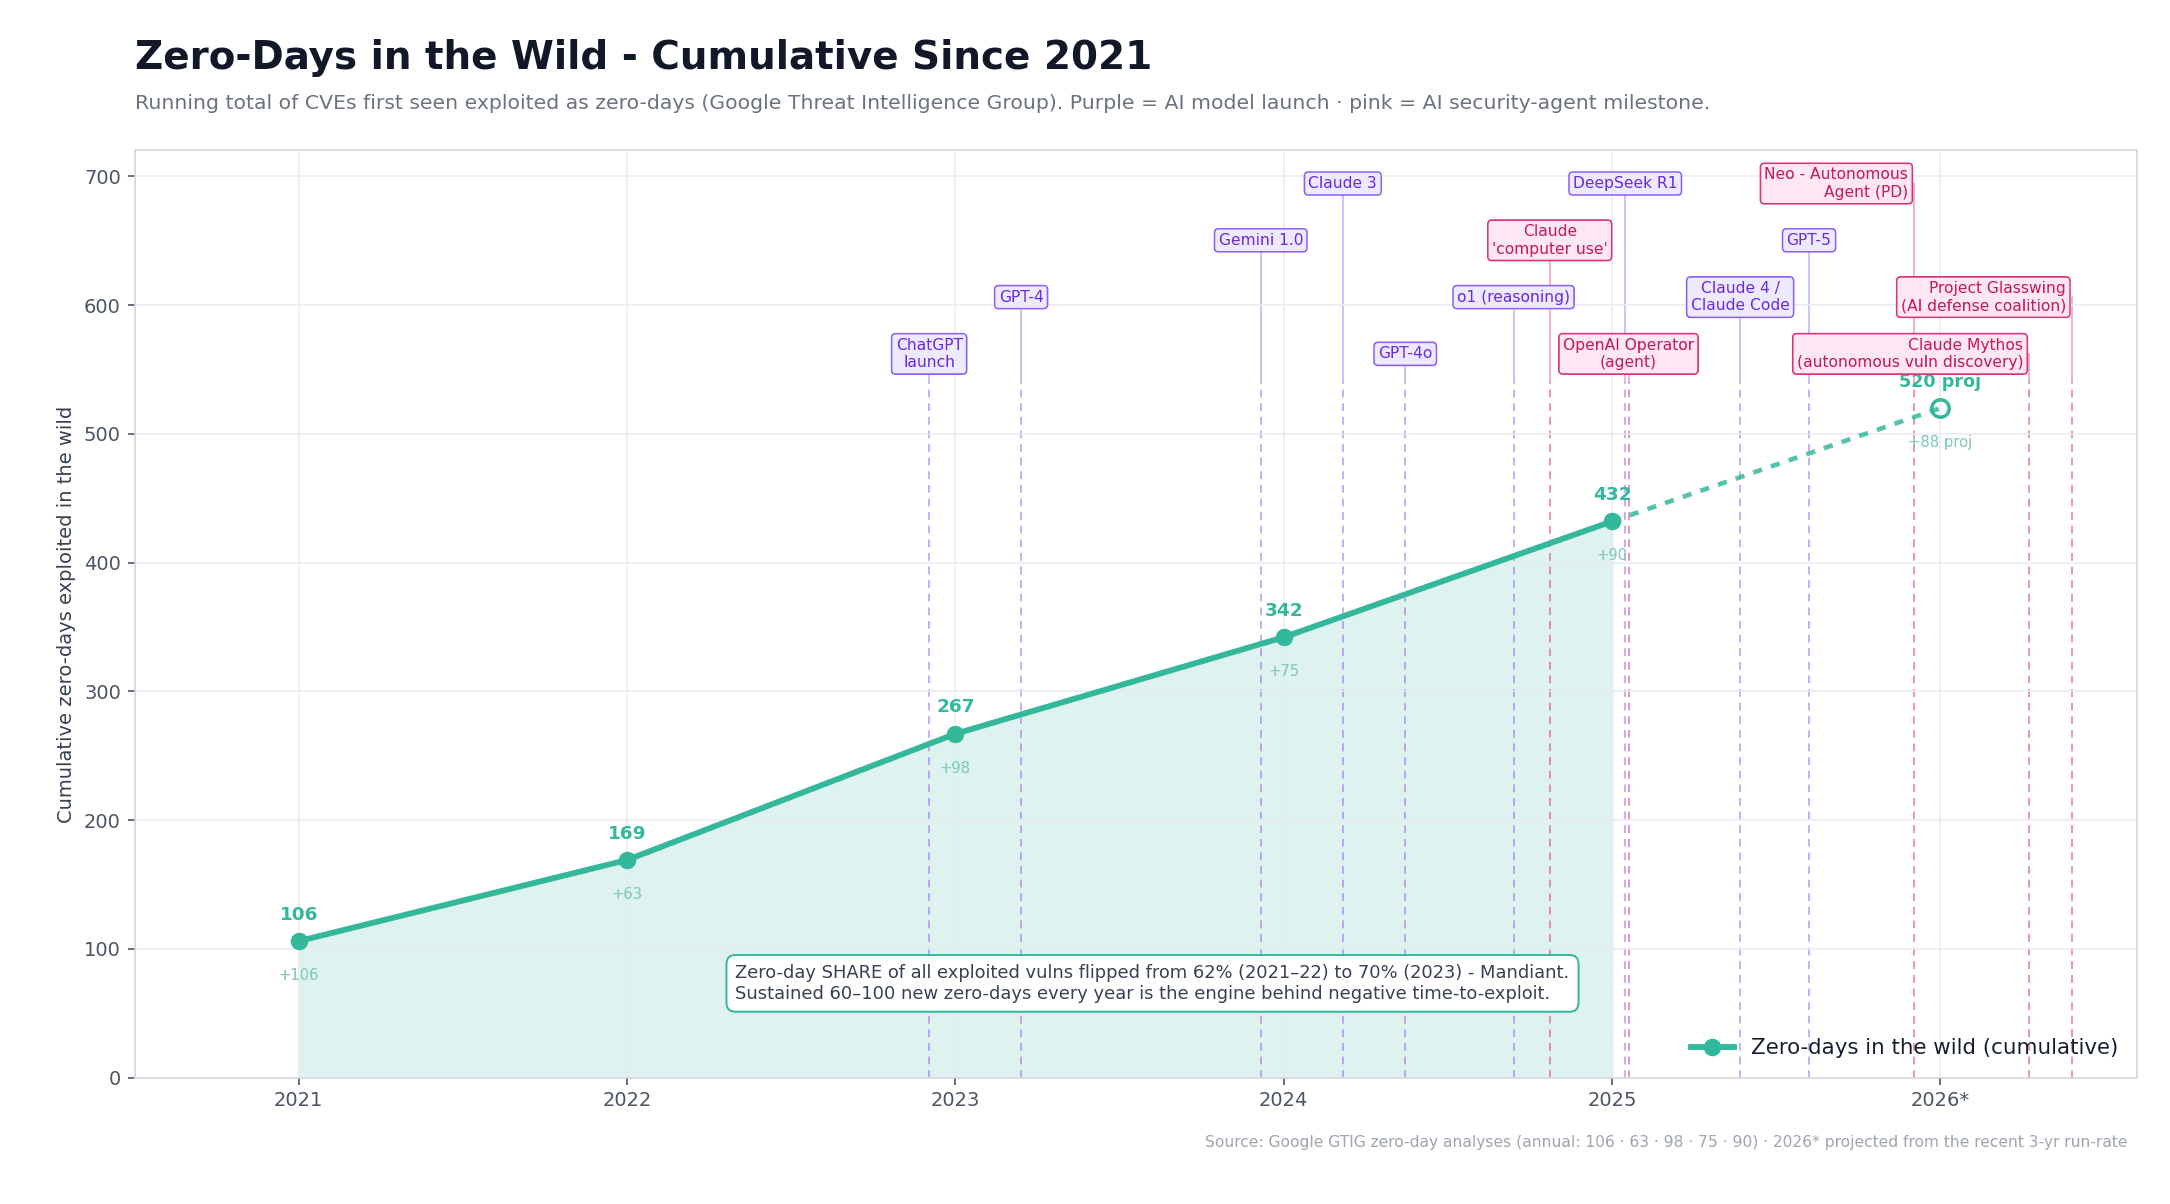
Google's Threat Intelligence Group counts the zero-days caught being exploited in the wild each year: 106 in 2021, then 63, 98, 75 and 90 through 2025, with 2026 on pace for roughly 88 more. That is a steady 60 to 100 every year, far above the pre-2021 norm of 20 to 30. The chart above adds those yearly counts into a running total, which is why the line keeps climbing and crosses 430 by the end of 2025. Every one of those was a live attack that no patch could have stopped at the time.
The trend underneath is the part that should worry defenders. Mandiant took the vulnerabilities actually used in attacks and measured how many were zero-days versus n-days. In 2021–22 the split was 38% n-day to 62% zero-day. By 2023 it had moved to 30/70, meaning roughly seven of every ten exploited bugs were hit before a patch was even available.
That inverts the entire defensive playbook. When most exploited bugs were n-days, patching on a sane cadence bought you real safety, because the exploit showed up after the fix did. At a 70% zero-day rate, the majority of real-world exploitation lands on bugs you could not have patched in time no matter how fast you moved. You cannot remediate your way out of a vulnerability nobody has disclosed yet. That single fact is what drags the next number, time-to-exploit, below zero.
4. Time-to-exploit went negative
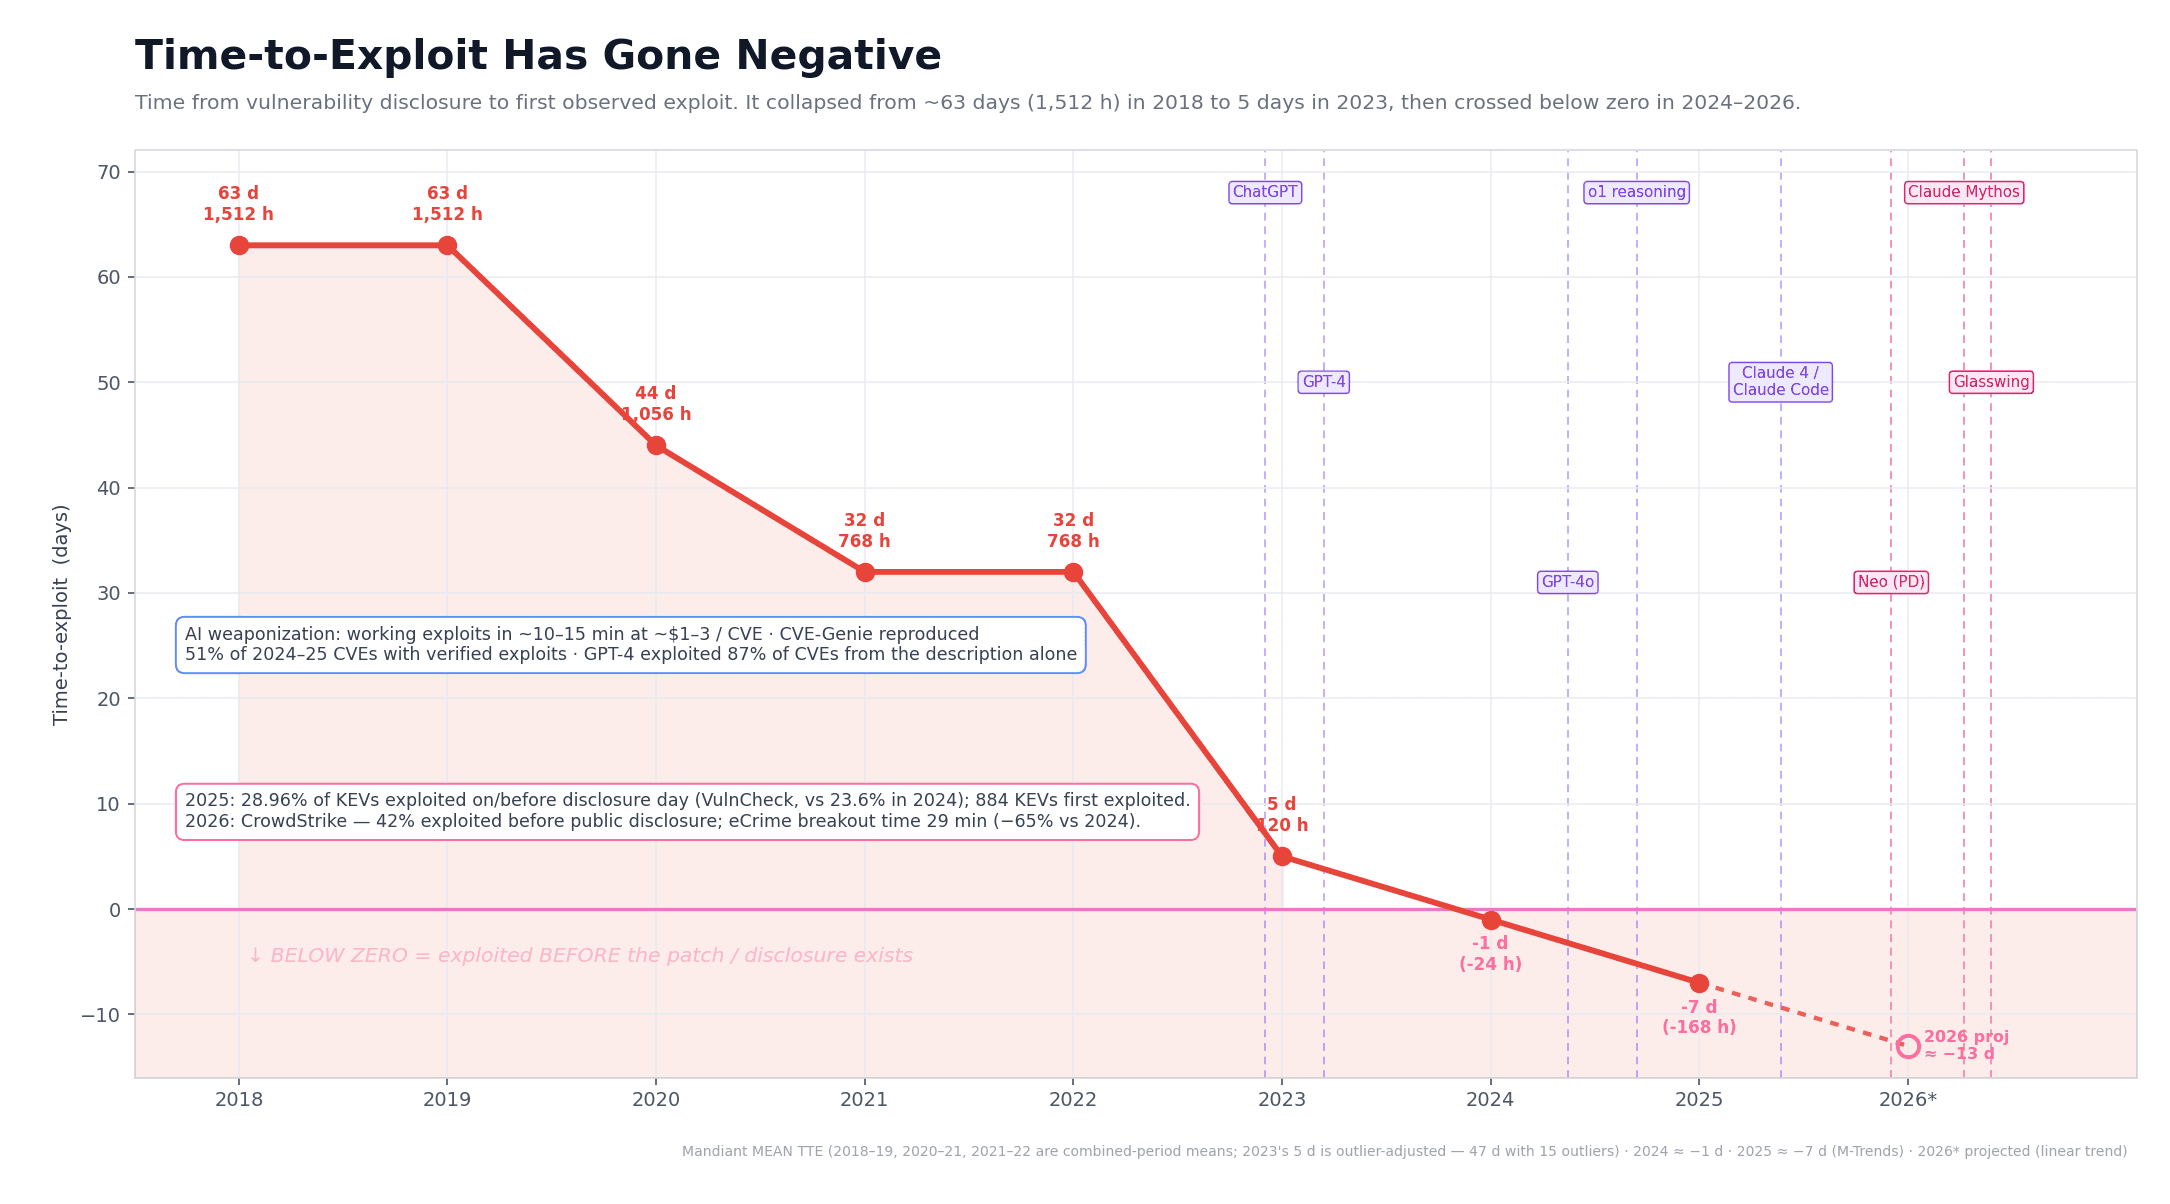
Mandiant tracks the mean time from disclosure to first observed exploit. It collapsed:
- 2018–2019: 63 days (1,512 hours)
- 2020–2021: 44 days
- 2021–2022: 32 days
- 2023: 5 days (120 hours)
- 2024: ≈ −1 day
- 2025: ≈ −7 days
- 2026 (projected): ≈ −13 days, the linear trend extrapolated one year
In 2024 the figure crossed below zero. Across the vulnerabilities Mandiant analyzed, the average exploit was observed before the CVE was public. "Negative time-to-exploit" means attackers weaponize flaws ahead of the patch, via disclosure-pipeline and repo leaks and increasingly via AI that writes a working exploit faster than a human can read the advisory.
The AI-speed evidence is on the chart. AI systems generate working CVE exploits in ~10–15 minutes at ~$1–3 per attempt. The CVE-Genie framework reproduced 51% of all 2024–2025 CVEs with verified exploits at an average $2.77 each. GPT-4 exploited 87% of tested CVEs from the description alone.
A note on the metric: these are Mandiant mean time-to-exploit figures throughout (2018–19, 2020–21 and 2021–22 are reported as combined-period means). Two honest caveats. The headline 5 days for 2023 is outlier-adjusted, Mandiant removed 15 statistical outliers. With them included, the 2023 average is 47 days. The negative 2024 and 2025 figures reflect the mean being dragged below zero by a heavy tail of pre-disclosure (zero-day) exploitation. The 2026 value is a projection, the same downward trend extrapolated one year rather than a measured figure. The direction is not in dispute. The exact magnitude depends on outlier handling.
5. The exposure gap
Put attacker speed and defender speed on one axis and you get the single most uncomfortable picture in the dataset.
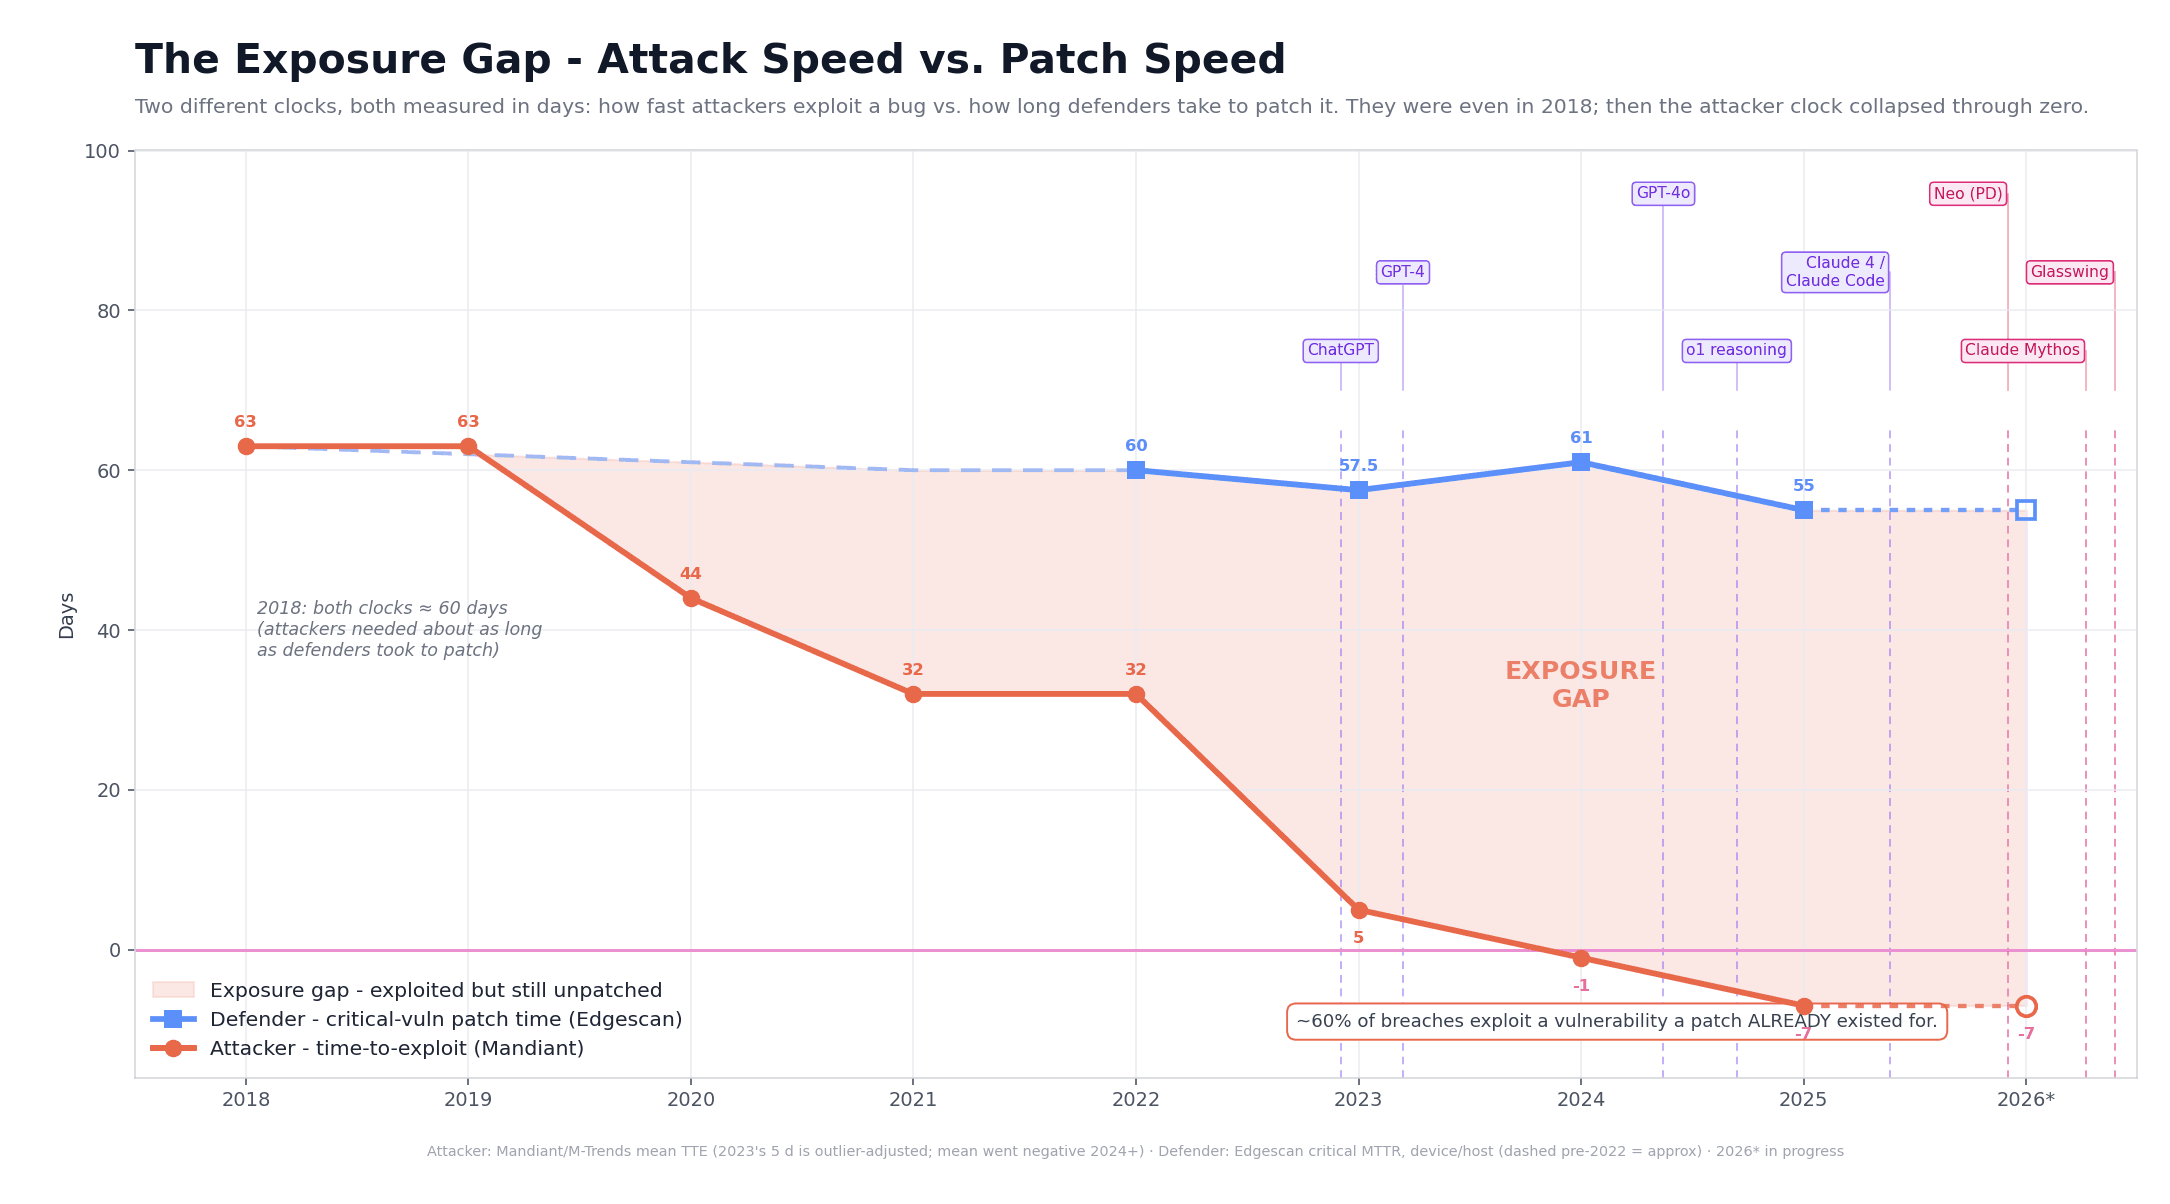
Two independent metrics, both measured in days:
In 2018 the two clocks were even, attackers needed about as long to weaponize a bug as defenders needed to patch it, so there was effectively no gap. Since then the attacker clock fell off a cliff while the defender clock barely moved. By 2024–2026 there's a ~60-day window where a vulnerability is already being exploited and most organizations still haven't patched it.
That window is the exposure gap and it's why roughly 60% of breaches involve a vulnerability for which a patch already existed.
(These are two different measurements, disclosure→exploit vs. discovery→fix, so the gap is an illustrative comparison, not a like-for-like subtraction. Pre-2022 defender values are approximate and drawn dashed.)
6. The human triage system broke
Volume this large doesn't just stress defenders, it broke the system the whole industry leans on for vulnerability context.
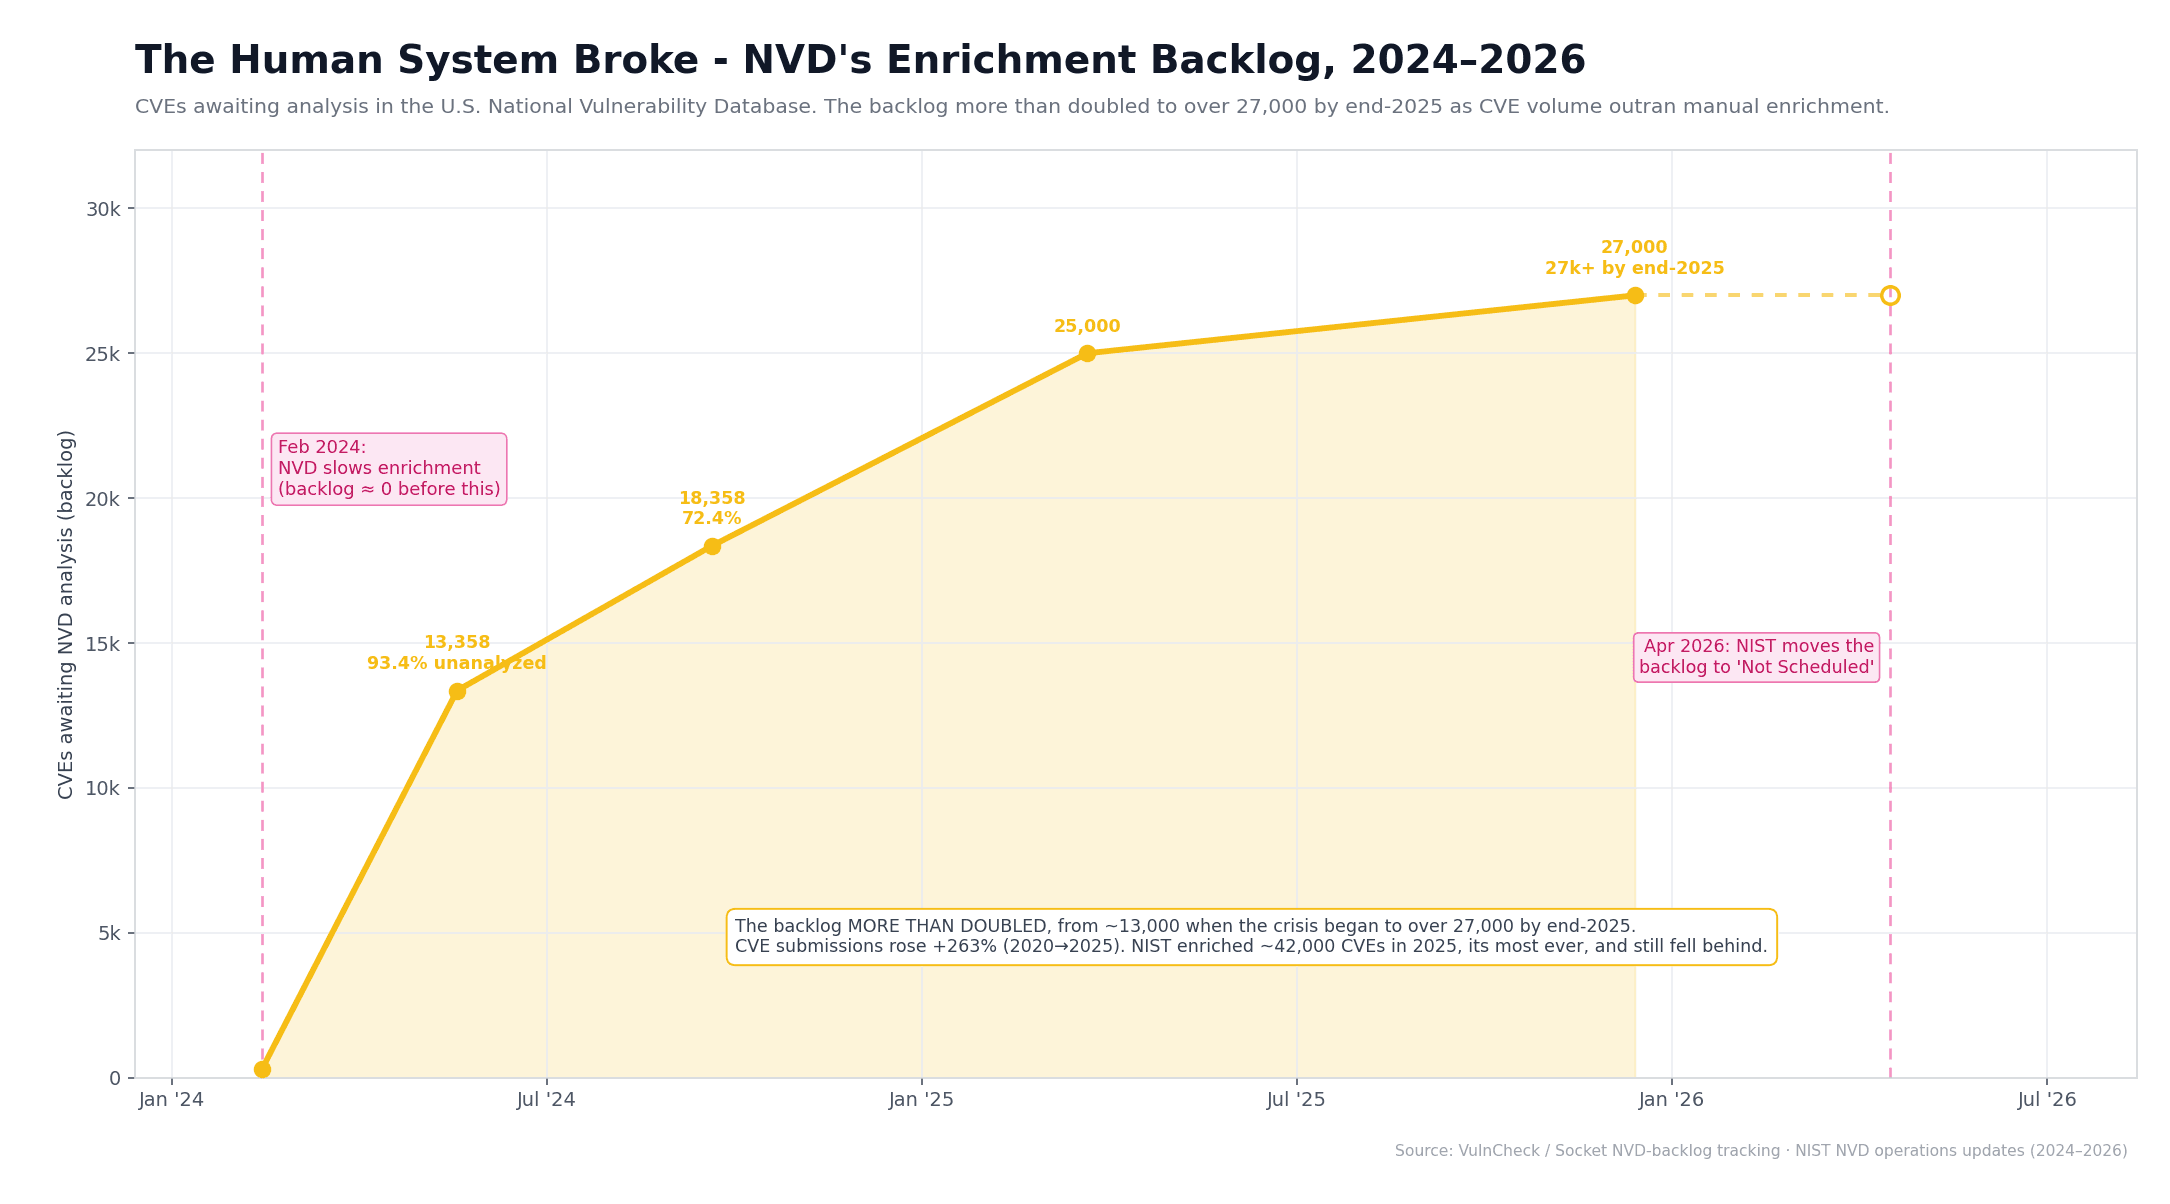
On February 12, 2024, the U.S. National Vulnerability Database slowed enrichment. The backlog of CVEs awaiting analysis climbed from roughly 13,000 in mid-2024 to 18,358 by September (72.4% of new CVEs unanalyzed), then to 25,000 by March 2025 and over 27,000 by the end of 2025, more than double where it started (Socket). CVE submissions had risen +263% from 2020 to 2025. NIST enriched about 42,000 CVEs in 2025, its most ever and still fell behind. In April 2026 it gave up on the backlog, moving everything older than March 2026 to "Not Scheduled" and enriching only KEV and high-risk CVEs going forward.
The manual, human-paced process that gave every CVE its context simply could not keep up with machine-paced output.
7. The supply-chain front
Disclosed CVEs are one attack surface. The software supply chain is the other and it's growing on the same curve.
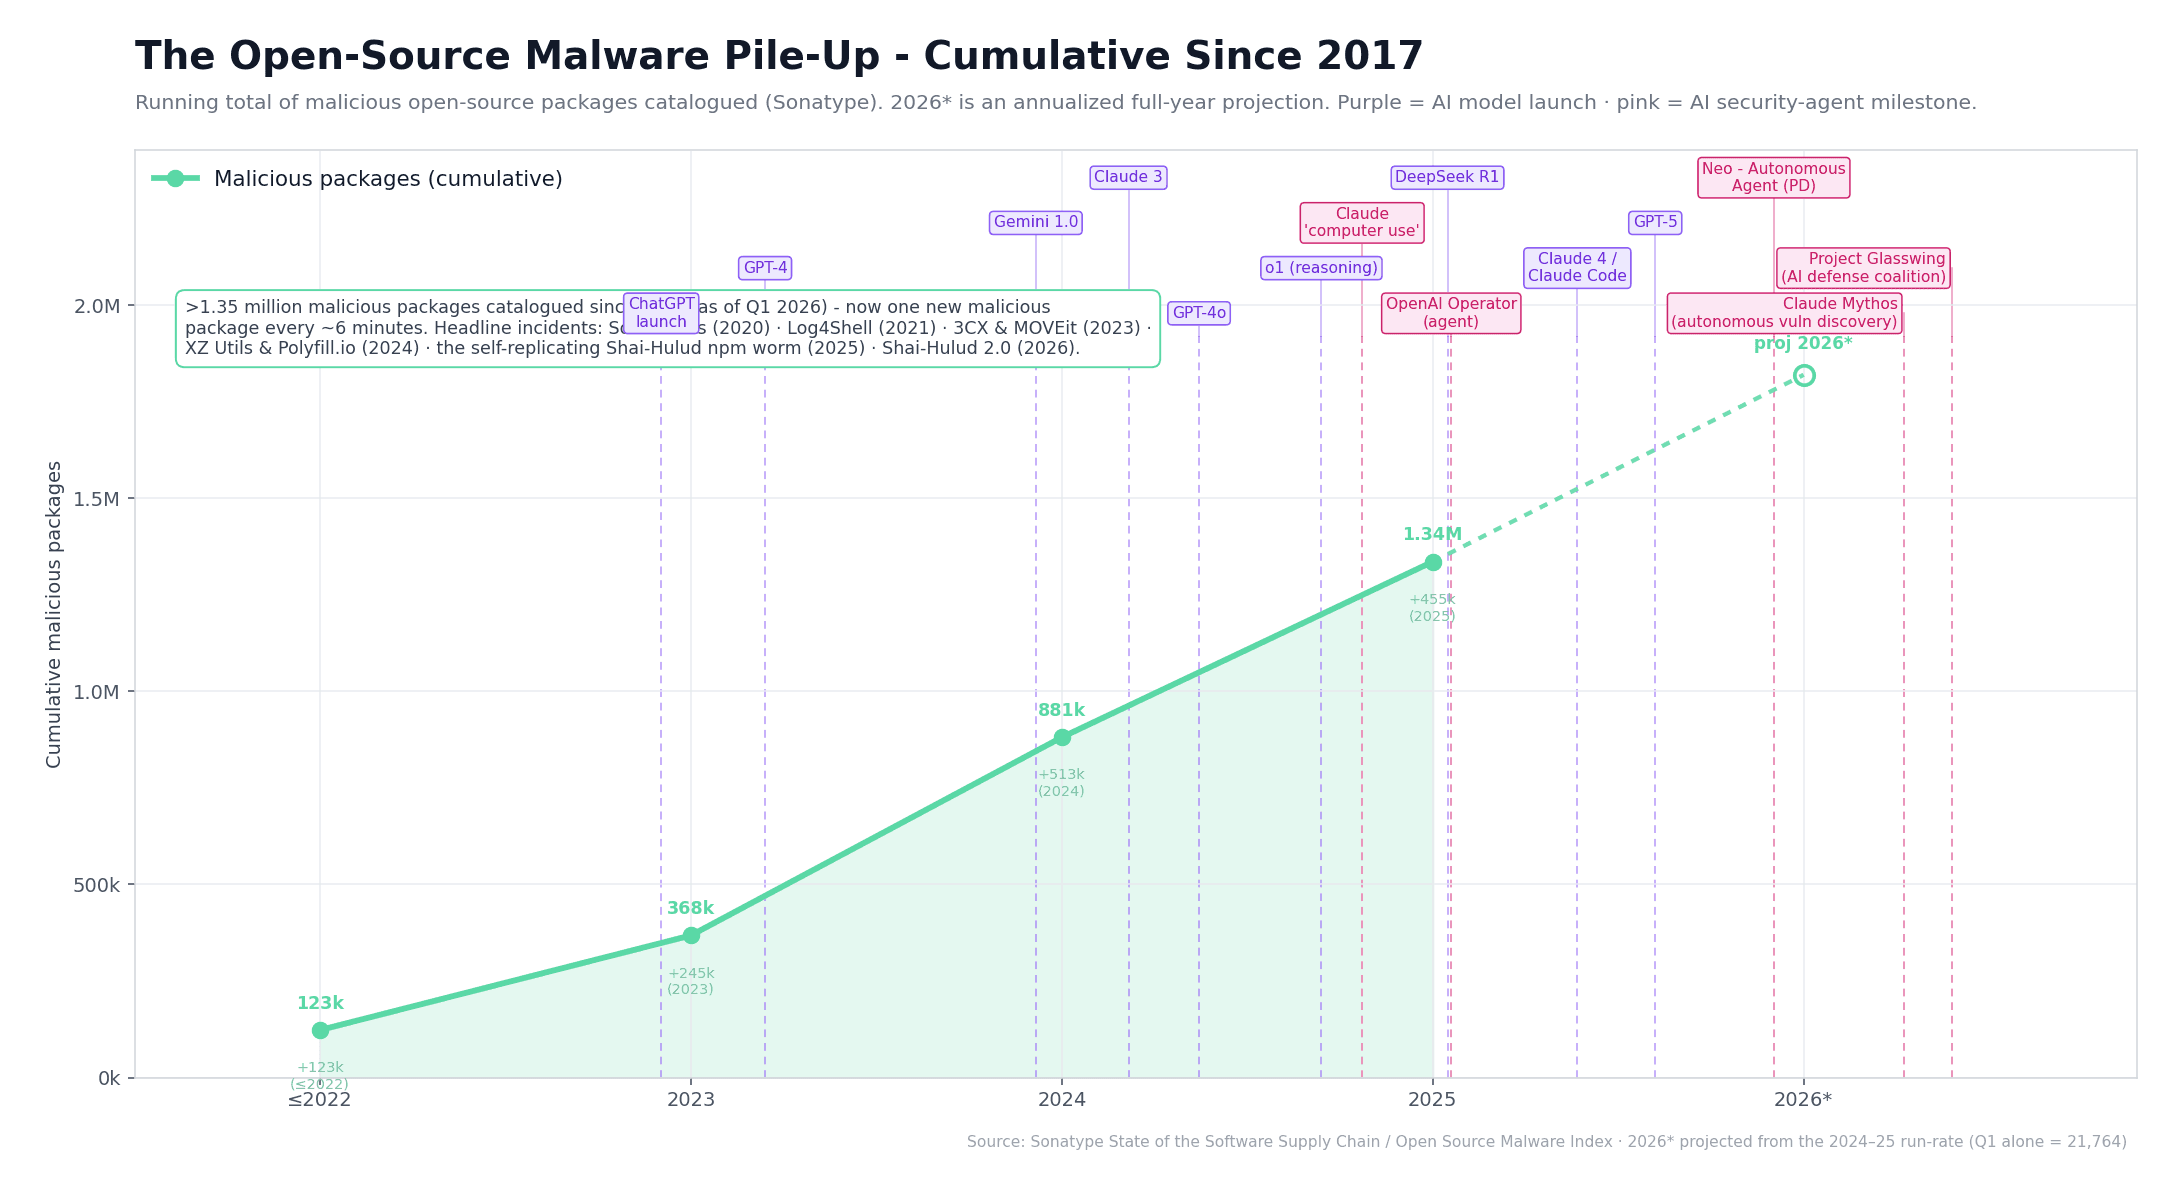
Sonatype's count of malicious open-source packages: ~123k across all of 2019–2022 combined, then 245,032 in 2023 (more than double all prior history), 512,847 in 2024 and 454,648 in 2025, with 21,764 in the first quarter of 2026 (a deliberately low-looking quarter, since the malware skews heavily to Q4). That has pushed the catalogued total past 1.35 million, now one new malicious package roughly every six minutes. On the recent annual run-rate, 2026 projects to around 1.8 million cumulative. The headline incidents track right alongside: SolarWinds (2020), Log4Shell (2021), 3CX and MOVEit (2023), the XZ Utils backdoor and Polyfill.io (2024) and the self-replicating Shai-Hulud npm worm of 2025, which spread to 500+ packages on its own, followed by Shai-Hulud 2.0 in 2026.
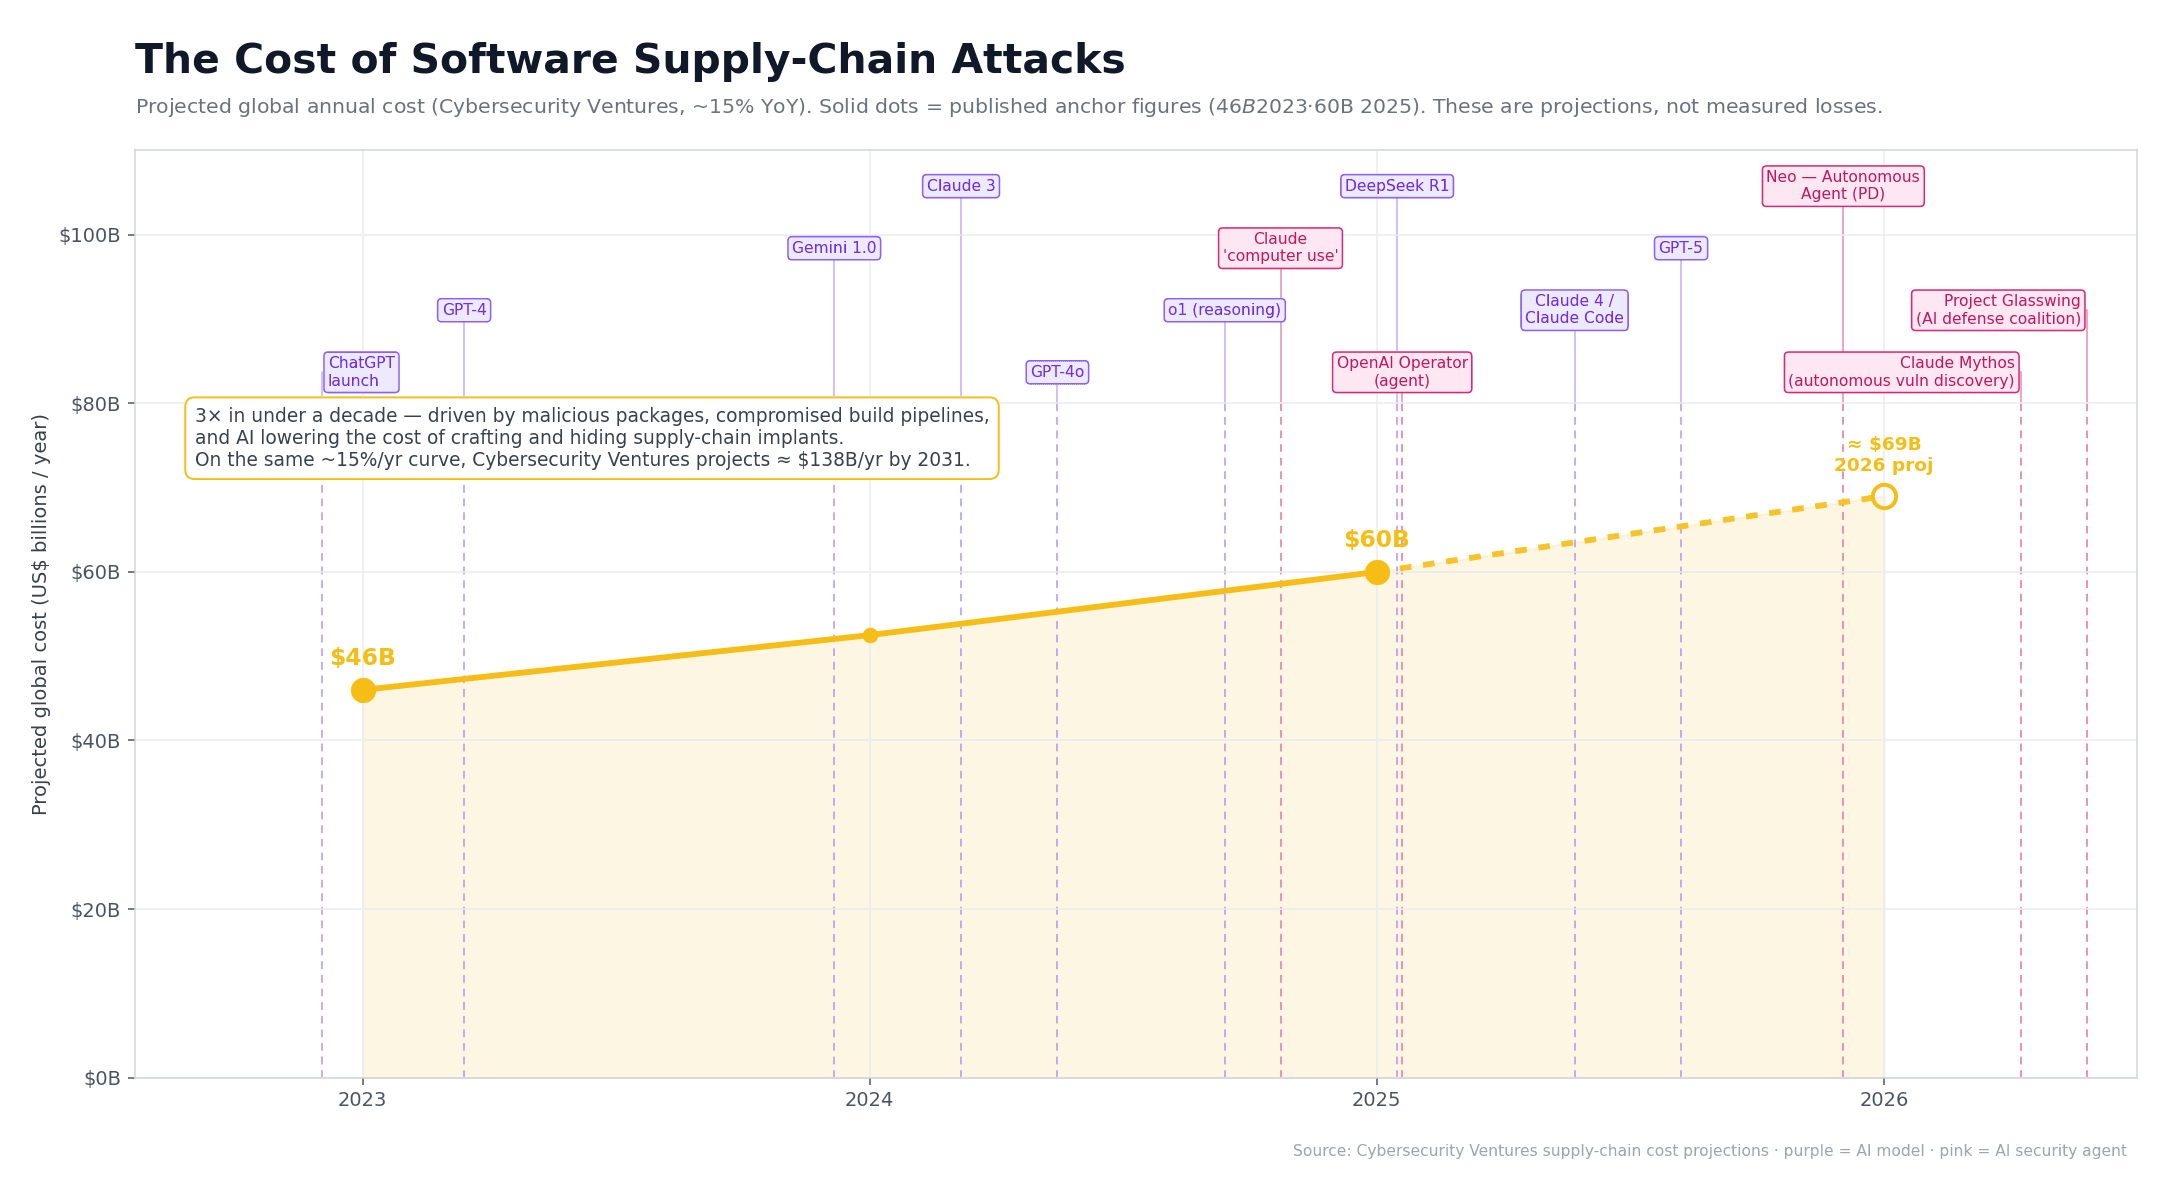
The cost follows. Cybersecurity Ventures projects the global annual cost of software supply-chain attacks rising from $46B (2023) to $60B (2025) to roughly $69B in 2026, on a ~15%/yr curve that reaches an estimated $138B by 2031. These are projections, not measured losses, but the direction is not in dispute.
What this actually means
Step back and the dataset says something specific: AI sits on both sides of the chart. It inflated the discovery curve, more code, more bugs, more zero-days, faster exploits and the same capability now powers the agents that have to find and triage them.
Three things follow:
- Patch velocity is the whole game. When the median time-to-exploit is days and the mean is negative, a 55-day critical-remediation cycle is not a process, it's an open door. The exposure gap is a velocity problem and velocity problems are not solved by hiring.
- Annual, human-paced security can't cover machine-paced output. The NVD backlog is the canary: a careful manual process that worked for a decade fell over in a single year once volume went vertical. Point-in-time pentests and quarterly scans have the same failure mode.
- Defenders need to operate at the speed of the curve. If attackers are weaponizing bugs in minutes with AI, the response, finding them, proving they're real and handing developers a fix, has to run continuously and autonomously, not on a calendar.
That last point is where Neo, ProjectDiscovery's autonomous AI security engineer, fits. The interesting half of these charts isn't that AI broke the timeline, it's that the same kind of capability is the only thing that runs fast enough to defend it. Neo finds vulnerabilities across code, APIs and infrastructure, proves exploitability at runtime with real evidence and gives teams the payload, trace and reproduction steps to fix them, continuously, on every deploy, instead of once a year. When the gap between "disclosed" and "exploited" is measured in hours, the gap between "found" and "fixed" has to shrink to match.
The vulnerability curve bent with the AI curve. The defensive curve has to bend too.
To see Neo in action, request a demo or try it for yourself: https://projectdiscovery.io/pricing. The vulnerability data in this post is queryable yourself with vulnx.
References
- Vulnerability volume, severity & known-exploited counts (Charts 1, 7) - ProjectDiscovery: vulnx (live query, bucketed by CVE publication year
cve_created_at,doc_type:cve, faceted onseverity,is_ckev,is_vkev). Re-pulled and confirmed 2026-06-03. - CVE-volume confounder (Linux kernel CNA) - Linux kernel becomes a CVE Numbering Authority (Feb 2024): LWN, Risky Biz, sigma-star analysis. Quantified via vulnx (
affected_products.vendor:linux): 310 (2023) → 4,362 (2024) → 4,334 (2025); only 9 of 2024’s reached CISA KEV. - AI timeline markers (all charts) - Sam Altman ChatGPT launch tweet; OpenAI model release notes; Claude Mythos (Bain, Apr 2026); Project Glasswing (The Hacker News, Apr 2026).
- Zero-days exploited in the wild (Chart 10) - primary - Google Threat Intelligence Group: 2024 zero-day trends(63 in 2022, 98 in 2023, 75 in 2024); 2025 Zero-Day Review (90 in 2025). (2021: 106 from GTIG’s 2021 retrospective.)
- Time-to-exploit (Charts 9, 11, attacker line) - primary - Mandiant/Google: Time-to-Exploit trends (2023) (mean TTE 63 → 44 → 32 → 5 days; 2023 is outlier-adjusted; 138 vulns analyzed; 70% zero-day). Supporting: Hadrian on negative TTE (2024); M-Trends 2026 discussion; CSA: Collapsing exploit window / CVE-Genie / GPT-4 exploitability.
- Time-to-remediate (Chart 11, defender line) - primary PDFs - Edgescan: 2024 Vulnerability Statistics Report (PDF); 2023 report (PDF); 2025 report. Additional context: SecurityBoulevard ("46 vulnerability statistics 2026").
- NVD enrichment backlog (Chart 12) - VulnCheck: NVD backlog exploitation; Help Net Security: NIST shifts enrichment policy (Apr 2026); The Register: NVD unprocessed backlog (Oct 2024).
- Software supply chain (Charts 13, 14) - Sonatype: State of the Software Supply Chain; Q1 2026 Open Source Malware Index; Infosecurity Magazine: 156% increase in OSS malicious packages. Cost projections: Cybersecurity Ventures.